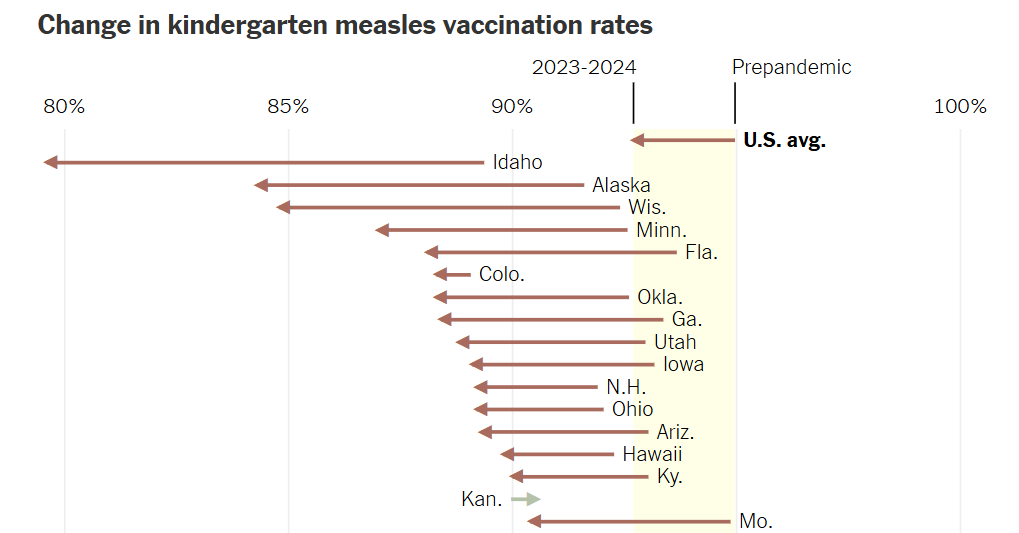
The graph above, about kindergarten measles vaccination rates, was published in The New York Times on Jan. 13, 2025.
Measles has been in the news lately because of outbreaks in Texas and New Mexico. Dani Blum, a health reporter for The New York Times, writes about how people can try to stay safe:
Measles outbreaks in Texas and New Mexico are fueling concerns about the rapid spread of the highly contagious virus.
There have been more than 100 measles cases in the United States so far this year, compared to 285 cases in all of 2024. And health officials have warned that they expect more people to fall ill.
The outbreaks come as the rate of childhood vaccinations, including against measles, have fallen. Most of the measles cases in recent outbreaks have been among people who were unvaccinated or whose vaccination status was unknown. Many have been young children, who are at particularly high risk. An unvaccinated child died in Texas from measles, health officials reported Wednesday.
Vaccines are the most effective tools to combat measles. Breakthrough cases — infections among the vaccinated — are extremely rare. But as outbreaks spread, it’s important to review your own vaccination status and make sure you are properly protected.
1. After looking closely at the graph above (or at this full-size image), answer these four questions:
What do you notice?
What do you wonder?
The questions are intended to build on one another, so try to answer them in order.
2. Next, join the conversation online by clicking on the comment button and posting in the box. (Teachers of students younger than 13 are welcome to post their students’ responses.)
3. Below the response box, there is an option to click on “Email me when my comment is published.” This sends the link to your response which you can share with your teacher.
4. After you have posted, read what others have said, then respond to someone else by posting a comment. Use the “Reply” button to address that student directly.
On Wednesday, March 5, teachers from our collaborator, the American Statistical Association, will facilitate this discussion from 9 a.m. to 2 p.m. Eastern time.
5. By Friday morning, March 7, we will reveal more information about the graph, including a free link to the article that includes this graph, at the bottom of this post. We encourage you to post additional comments based on the article, possibly using statistical terms defined in the Stat Nuggets.
Reveal
We’ll post more information here by Friday morning. Stay tuned!
More?
• See all graphs in this series or collections of 75 of our favorite graphs, 28 graphs that teach about inequality and 24 graphs about climate change.
• View our archives that link to all past releases, organized by topic, graph type and Stat Nugget.
• Learn more about the notice and wonder teaching strategy from this 5-minute video and how and why other teachers are using this strategy from our on-demand webinar.
• Sign up for our free weekly Learning Network newsletter so you never miss a graph. Graphs are always released by the Friday before the Wednesday live moderation to give teachers time to plan ahead.
• Go to the American Statistical Association K-12 website, which includes teacher statistics resources, Census in the Schools student-generated data, professional development opportunities, and more.
Students 13 and older in the United States and Britain, and 16 and older elsewhere, are invited to comment. All comments are moderated by the Learning Network staff, but please keep in mind that once your comment is accepted, it will be made public.


