After hearing feedback from shoreline residents and local officials in a series of virtual community workshops that the work was informative but didn’t estimate the riskiest scenarios, the scientists have updated their project with a more extreme scenario in which ice sheets in West Antarctica collapse.
If this occurs, San Francisco Bay could rise by 10.1 feet by 2100.
Differences in scientific modeling scenarios before the year 2050 are minor, but they diverge significantly after mid-century. The results depend on greenhouse gas emissions, which human beings will determine by the rate they burn fossil fuels.
“It was important to consider the worst-case scenario because, unfortunately, our leaders, especially at the federal level, have not risen to the challenge of addressing climate change,” said Cushing.
The researchers also used federal groundwater data to examine how rising ocean water would drive freshwater up from the ground.
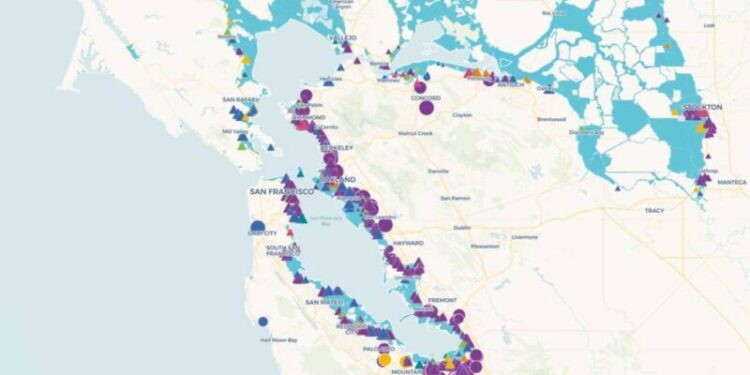
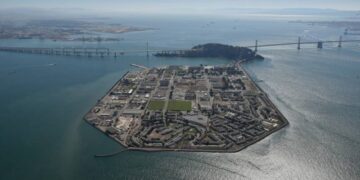
The research highlights the Hunters Point Naval Shipyard and a cluster of other hazardous sites in the San Francisco neighborhood of Bayview-Hunters Point. And dozens of power plants, refineries, landfills and other industrial sites line communities like East Palo Alto, Richmond, Oakland and San Jose.
“[Sea level rise] can enhance the risk of groundwater encroachment, particularly in sites where there are toxic contaminants in the soil, or even in the groundwater,” said Morello-Frosch.
This is especially important to understand, she said, for places where toxic contamination is in soil with a cap — often made of concrete, clay or strong plastic-like materials — holding it in place to protect the public and the environment. The problem with these caps: Rising groundwater from below could eat away at the pollution, spread it to other areas or bring that contaminated water aboveground, exposing people and San Francisco Bay itself.
The scientist’s findings showcase significant risk. But they note that understanding the effect of sea level rise and groundwater encroachment on each hazardous facility will take site-specific data. This could include the level of contamination, the depth of groundwater, any existing caps, or sea walls and other protective measures.
“It’s important to develop these tools because you want to get all of this data together in one place,” Morello-Frosch said. “There needs to be some coordinated effort to begin to respond.”
Data sources
The Toxic Tides team provided KQED with the map’s data layers, which feature the high-risk aversion scenario for sea level rise as described in the latest state guidance.
Groundwater data originates from the U.S. Geological Survey. The data layer shows 3 meters (9.8 feet), which corresponds most closely to the degree of sea level rise for the high-risk aversion scenario.
Flood risk projections are based on rising sea levels, tides and storm surge. Site-specific details about groundwater contamination are not included in these findings. Scientists derived hazardous site data from federal databases that track landfills, toxic cleanup sites, refineries, sewage treatment plants and other sites.
The databases include the U.S. EPA Facility Registry Service, the U.S. Energy Information Administration’s U.S. Energy Atlas, the U.S. Army Corps of Engineers’ Waterborne Commerce Statistics Center, and the Enverus database of oil and gas well permits. The authors say “a lack of groundwater data coupled with imprecise estimates of facility boundaries may lead to potential underestimates of the number of at-risk facilities.”
The findings do not include an exhaustive list of all potentially contaminated sites, like underground storage tanks or other industrial sites with contamination. Find more information on the San Francisco Bay Conservation and Development Commission’s Bay Shoreline Flood Explorer or the San Francisco Baykeeper Sea Level Rise and Pollution Risk to the Bay website.


